It’s all change in our latest Scarcity Index Update!
So you think you’ve found a rare coin in your change, but how do you know how scarce it really is? Well, mintage figures only tell part of the story…
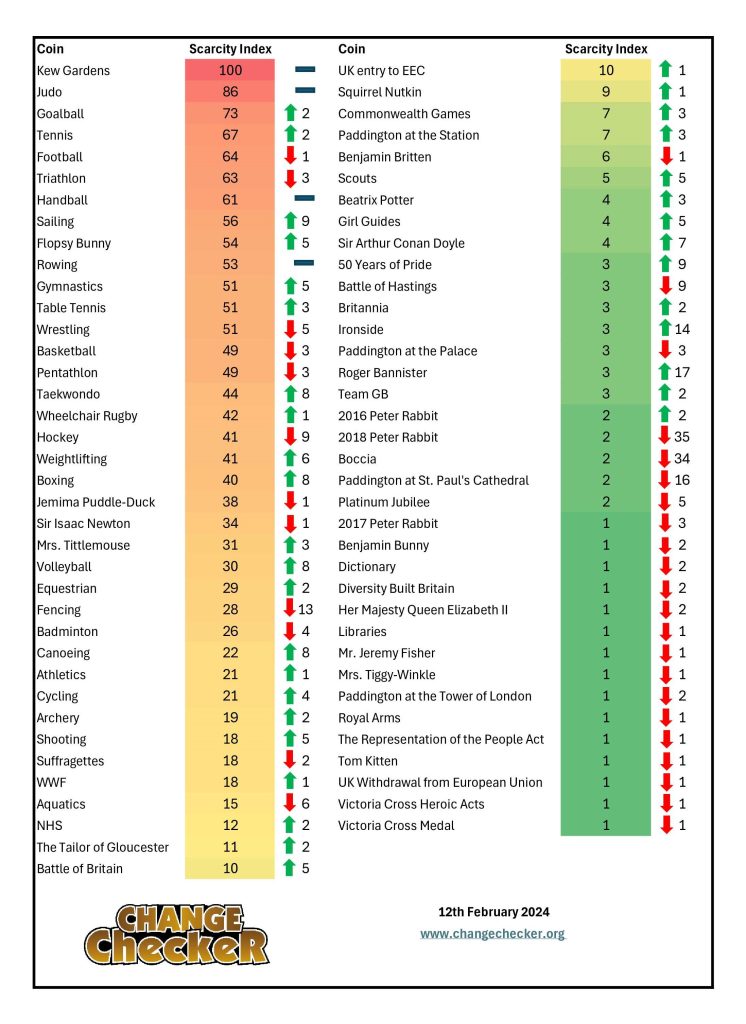
Our Scarcity Index uses data from the Change Checker Swap Centre to determine just how scarce and sought-after your coins are. The information is presented in the easy-to-use indexes below, with arrows to signify how many places up or down a coin has moved since the last Scarcity Index update.
50p Scarcity Index
It’s all change on our latest 50p index, with all but 3 coins moving at least 1 place.

Of course, right at the top is a non mover, the Kew Gardens 50p, closely followed by the Olympic Judo 50p. A select few Olympic 50ps regularly move around at the top of the list, however after climbing to 2nd place in our last index, the Judo 50p holds its spot and surprisingly, the coveted Football 50p has been bumped down slightly.
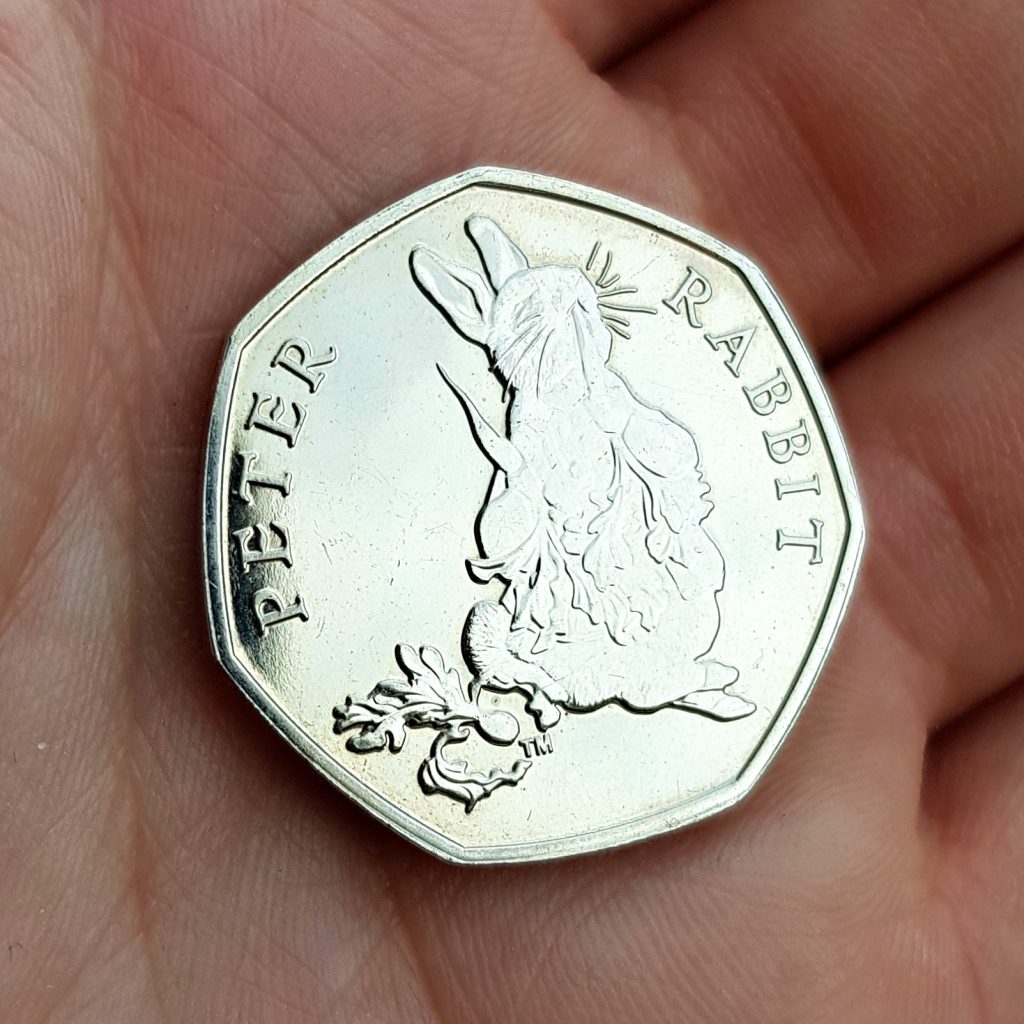
On to the big movers…and one Olympic 50p that has dropped a massive 34 places is the Boccia 50p, putting it back to where it was about a year ago. Also moving down is the 2018 Peter Rabbit 50p which has gone down 35 places and the Paddington at St Paul’s Cathedral 50p which has dropped 16 places.

It’s not all bad news for the 50ps though, because the Roger Bannister 50p and the Ironside 50p have climbed 17 and 14 places respectively. The Roger Bannister 50p has a mintage of just over 9 million and the Ironside 50p 7 million, making them some of the more common commemorative 50ps in circulation, so this shakeup on the index is definitely interesting.

Other notable movers are the Fencing 50p which has dropped 13 places, and the Taekwondo, Boxing, Volleyball and Canoeing 50ps which have all climbed 8 places.
If you’re new to collecting and want to find out more about circulation coins, you can check out our fact files here >>
Otherwise, keep reading to find out which 10ps and £2 coins you should be looking out for.
10p Scarcity Index
Once again, the A-Z 10p Scarcity Index has had quite a shake up, with only 4 coins staying put since our last update.

Coins climbing up the ranks include the O for Oak 10p which has risen by 9 places and the K for King Arthur and I for Ice Cream 10ps which both shot up by 6 places.
Falling almost to the bottom of the index is the N for NHS 10p which went down by 12 places since our last update and the F for Fish and Chips 10p which fell by 9 places.

*Note*
It’s worth remembering that this Index only ranks the 10ps against each other, when really even the ones at the bottom of the list are still incredibly sought-after. And that’s no surprise, as a maximum of JUST 304,000 of each A-Z 10p design entered circulation across 2018 and 2019.
It’s thought that a large percentage of these 10ps have been snapped up by collectors, leaving a limited amount still in circulation, so make sure you keep an eye out for them in your change!
£2 Scarcity Index
We usually see less movement on the £2 index due to the fact that less coins have entered circulation in recent years, however this time, there have been some big movers.

Climbing an impressive 13 places is the Shakespeare Tragedies £2, which was previously 1 place from the very bottom of the index. Out of the 3 Shakespeare coins, the Comedies £2 has the lowest mintage figure, however this one has fallen by just one place.

Another surprising change is the Guinea £2 which has fallen by 17 places since our last update, putting it almost at the bottom of the index. When it was issued in 2013, just 2,990,000 Guinea £2 coins entered circulation, so despite it now ranking as common on our Scarcity Index, it’s still one of the rarer £2s out there.
And of course, the Commonwealth Games N. Ireland £2 remains at the top of the list due to it’s incredibly low mintage of just 485,000.
How your Scarcity Index works
Generally collectors have relied on mintage figures to identify the scarcest coins. But they only tell part of the story.
Trying to find a good quality coin from 15 – 20 years ago, even for a higher mintage issue, is much more challenging than a more recent issue, as coins become damaged over time and are ultimately removed from circulation.
What’s more, some designs are more hoarded than others by people who might not normally collect coins – for example the First World War £2 Coin series.
Finally, it can be up to a couple of years before the Royal Mint eventually confirms the actual mintage for an issue.
That’s why we have combined the mintage information with two other key pieces of information:
- How many of each design are listed as “collected” by Change Checkers, indicating the relative ease of finding a particular coin
- The number of times a design has been requested as a swap over the previous 3 months, showing the current level of collector demand
Importantly, as new coins are released and popularity rises and falls across different designs, the Scarcity Index will be updated quarterly. This allows Change Checkers to track the relative performance of the UK’s circulation coins.
How much are my coins worth?
The Scarcity Index doesn’t necessarily equate to value, but it is certainly a good indicator. For example, the Kew Gardens 50p coin commands a premium of up to 200 times face value on eBay and is unsurprisingly top of the 50p Index.
You can use our 6 point guide to help you determine a more realistic value for your coins.
What about £1 Coins?
The £1 Scarcity Index has already been published for the Round £1 coins. Because they are no longer being issued, this is now set in stone.
Receive new UK coins without the hassle of placing orders on the day of release!
Join the Change Checker UK CERTIFIED BU Subscription Service and receive new UK coins sent to your door without the hassle of placing orders on the day of release!
Don’t miss your chance to get ahead of the crowd and be one of the very first collectors to receive the latest UK new issue coins as soon as possible after their release.


This index is fine for collectors who only collect the designs, but for those of us who collect coins in series, I am unsure of the value of this index. For example, the Britannia £2 is ranked with an index of 20, but was not issued for 3 years, so those years would have a far higher index. Similarly, variants such as the slavery £2 with different field finishes on the reverse, are not separated (the plain one is very rare). The Issac Newton 50p was minted in limited numbers in 2018 (via mint your own), whereas your index again lumps the two years together. As for the “Blue Peter” Athletics 50p of 2009 with a mintage of under 20,000 doesn’t get a mention, yet Kew gardens with 10 times that minted, remains top dog. Food for thought?
Hi Adrian, our Scarcity Index uses information such as mintage figures, how many collectors listed a coin as being in their collection on our web app and how many swap requests were raised for each coin, so it doesn’t take factors into account such as error coins, strike your own coins or different finishes. Of course there are other things to consider when determining the scarcity of your coins, but our Scarcity Index is a good place to start 🙂
Kate
Absolutely no way a 2018 Peter Rabbit has a scarcity index of 2 with a mintage of just 1.4 Million – that has to be a mistake or a statistical anomaly
Very interesting